ILMApilot-project presentation material

Hi everybody,

I prepared some material to present the ILMApilot-project’s activities. It’s in Finnish for now but there are a lot of pictures that are worth more than a thousand words 🙂

You can find it here:  ILMApilot presentation materials 

The project is organised in pilots, designed to provide satellite-based air quality products for different purposes and users. One of the pilots has been carried on in collaboration with FMI’s expert service department. We built our air quality maps over Azerbaijan (figure below), where an FMI’s team is helping to implement an air quality monitoring system, via one of their many international cooperation projects. You can read about the project in Finnish and English here: FIN  ENG

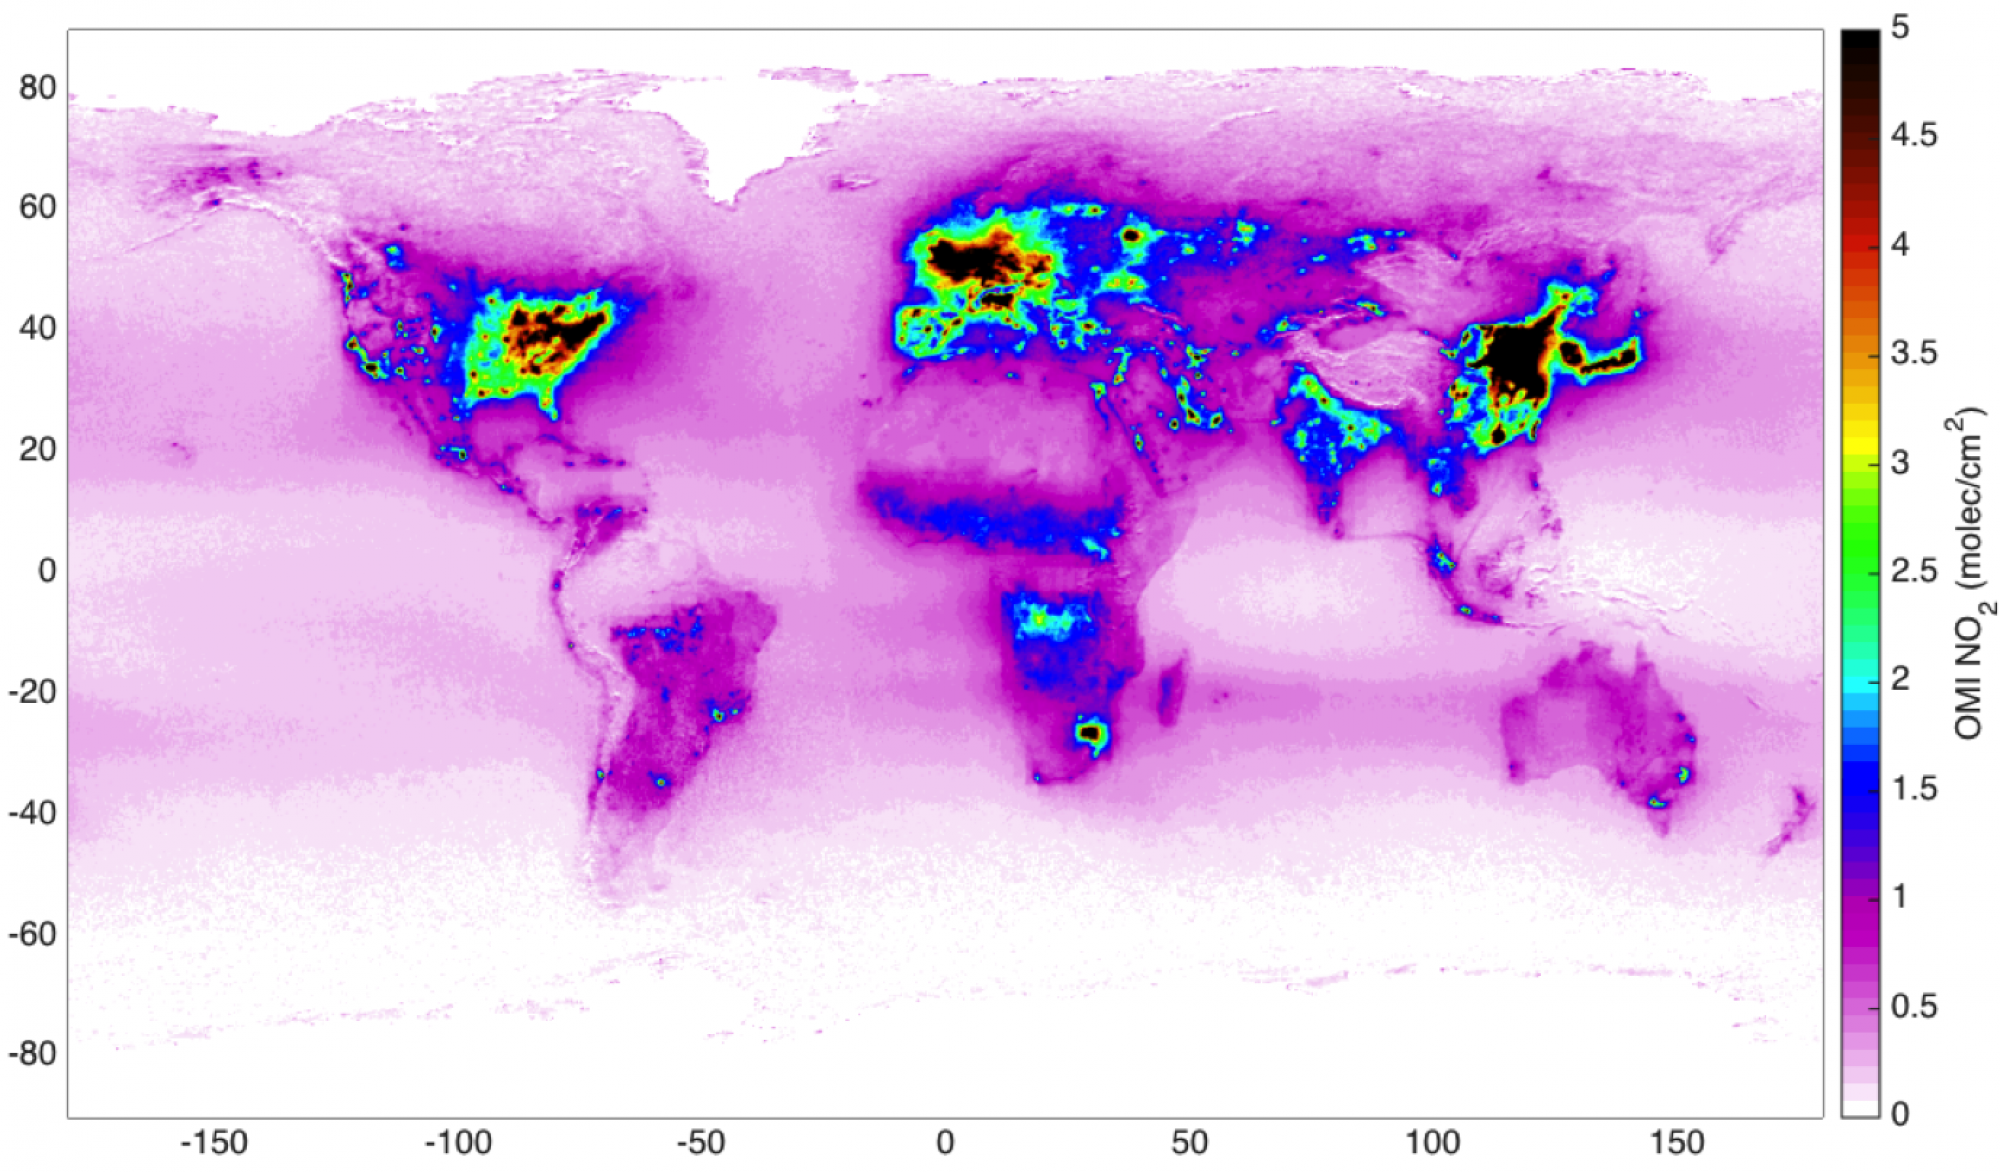
Yearly mean NO2 tropospheric columns over Azerbaijan in 2005, 2010 and 2016.

Our satellite-based NO2 maps were used as background information in an area where no other air quality measurements are available. The maps show for example increasing pollution levels over Baku (Azerbaijan’s capital and one of the most polluted cities in the world) from 2005 to 2016. The information about the NO2 distribution over the country provides also insights on where to place the ground-based air quality stations.

I hope to report more on future international collaborations very soon.

Iolanda

Report from EGU 2017

This week I’m in Vienna at the EGU (European Geosciences Union) General Assembly. It is the largest European gathering of scientists in the field of geosciences. Tomorrow I’ll give a talk about mapping anthropogenic CO2 emission areas using satellite-based observations. CO2 (carbon dioxide) is the most important anthropogenic greenhouse gas and it’s produced mostly by fossil fuel combustion.
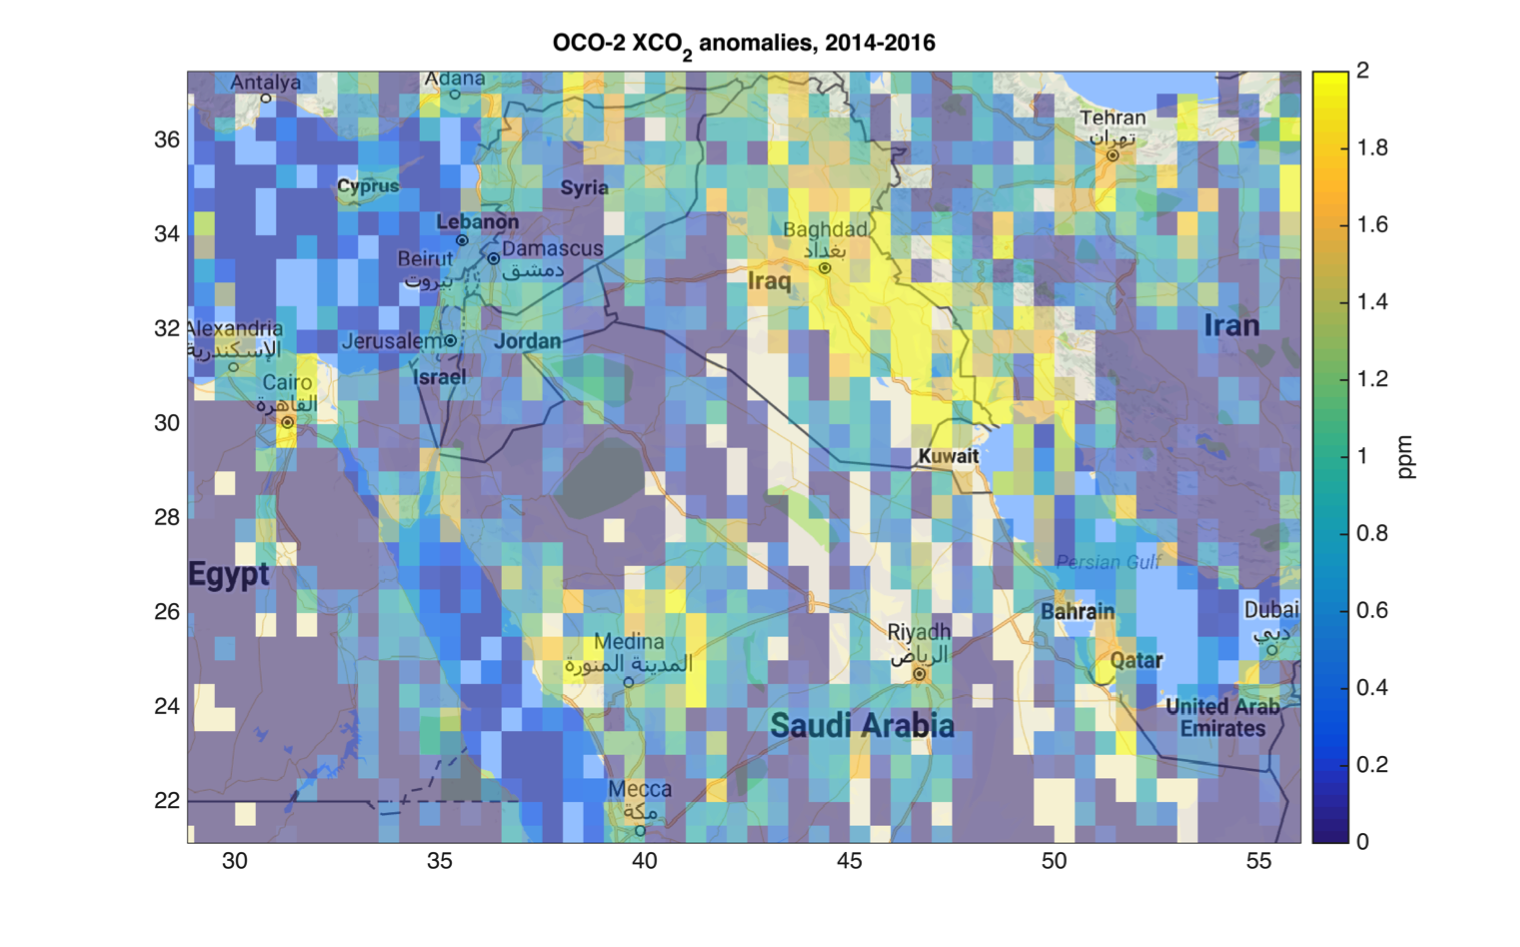
Our main finding was that satellite-based CO2 measurements alone can provide information about the areas where most of the atmospheric CO2 is produced. Satellite observations have revolutionised the way we monitor air pollution, for example providing very detailed maps of nitrogen dioxide (NO2), as I showed in my previous posts. Because of its long lifetime (many years), deriving information on the CO2 emission areas is not as simple, as CO2 gets transported far from its source. We developed a simple methodology to derive the CO2 anomalies and their spatial distribution. Look for example at the picture from the Middle-East region: we can spot oil extraction areas in Iraq and Saudi Arabia as well as isolated cities, such as Kairo, Riyadh, Mecca, Tehran and the state of Qatar.
Map of CO2 anomalies over the Middle-East derived from NASA’s OCO-2 measurements.
In this study we analysed the atmospheric CO2 concentrations measured by the NASA’s OCO-2 (Orbiting Carbon Observatory-2) instrument (available since September 2014). The results open new possibilities for monitoring anthropogenic CO2 from space. Further studies and new instruments will provide new insight on greenhouse gas monitoring and climate research. In the future, we might be able to verify the changes in the anthropogenic CO2 emissions and the effect of climate change mitigation actions.
If you are interested in the topic, you can have a look at the scientific paper by Hakkarainen et al. (2016): http://onlinelibrary.wiley.com/doi/10.1002/2016GL070885/full

Satellite-data goes Sodankylä

ILMApilot results featured in the expanded Arctic Space Center opening.

Last week we celebrated the opening of the expanded Arctic Space Center at the Finnish Meteorological Institute in Sodankylä and the inauguration of a new reception antenna. This extends the capability to receive atmospheric and surface data from several satellites and enable various applications based on such information. The event included the contribution from several speakers and our OMI (Ozone Monitoring Instrument) work got a really nice shout-out by the KNMI general manager. You can watch the full event here. The event happens on the same year Finland celebrates its 100th birthday and starts the chairmanship of the Arctic Council.

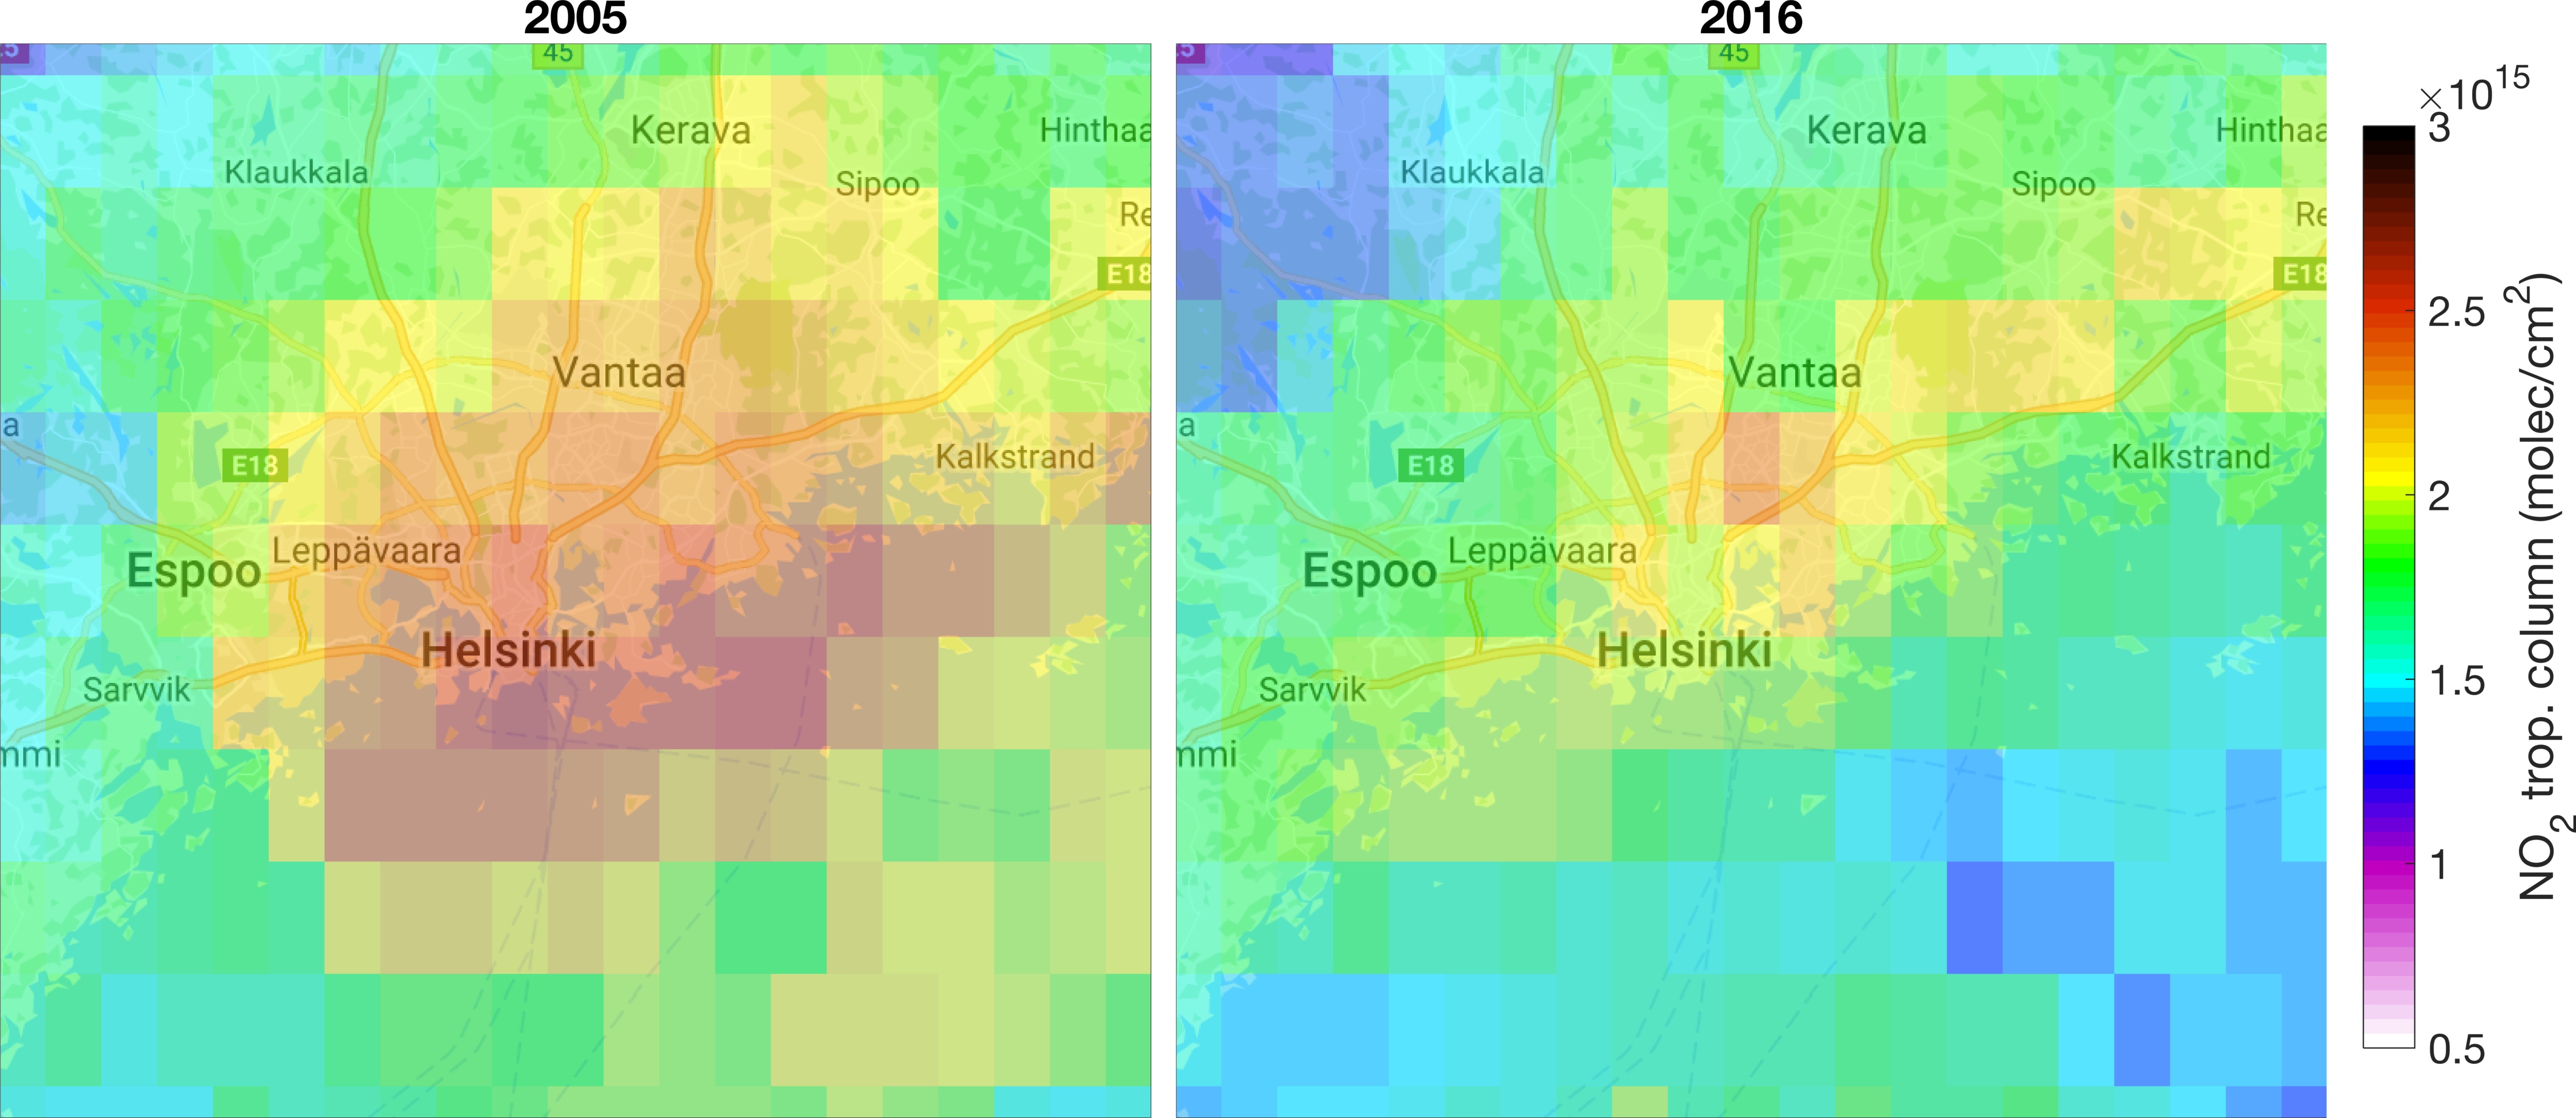
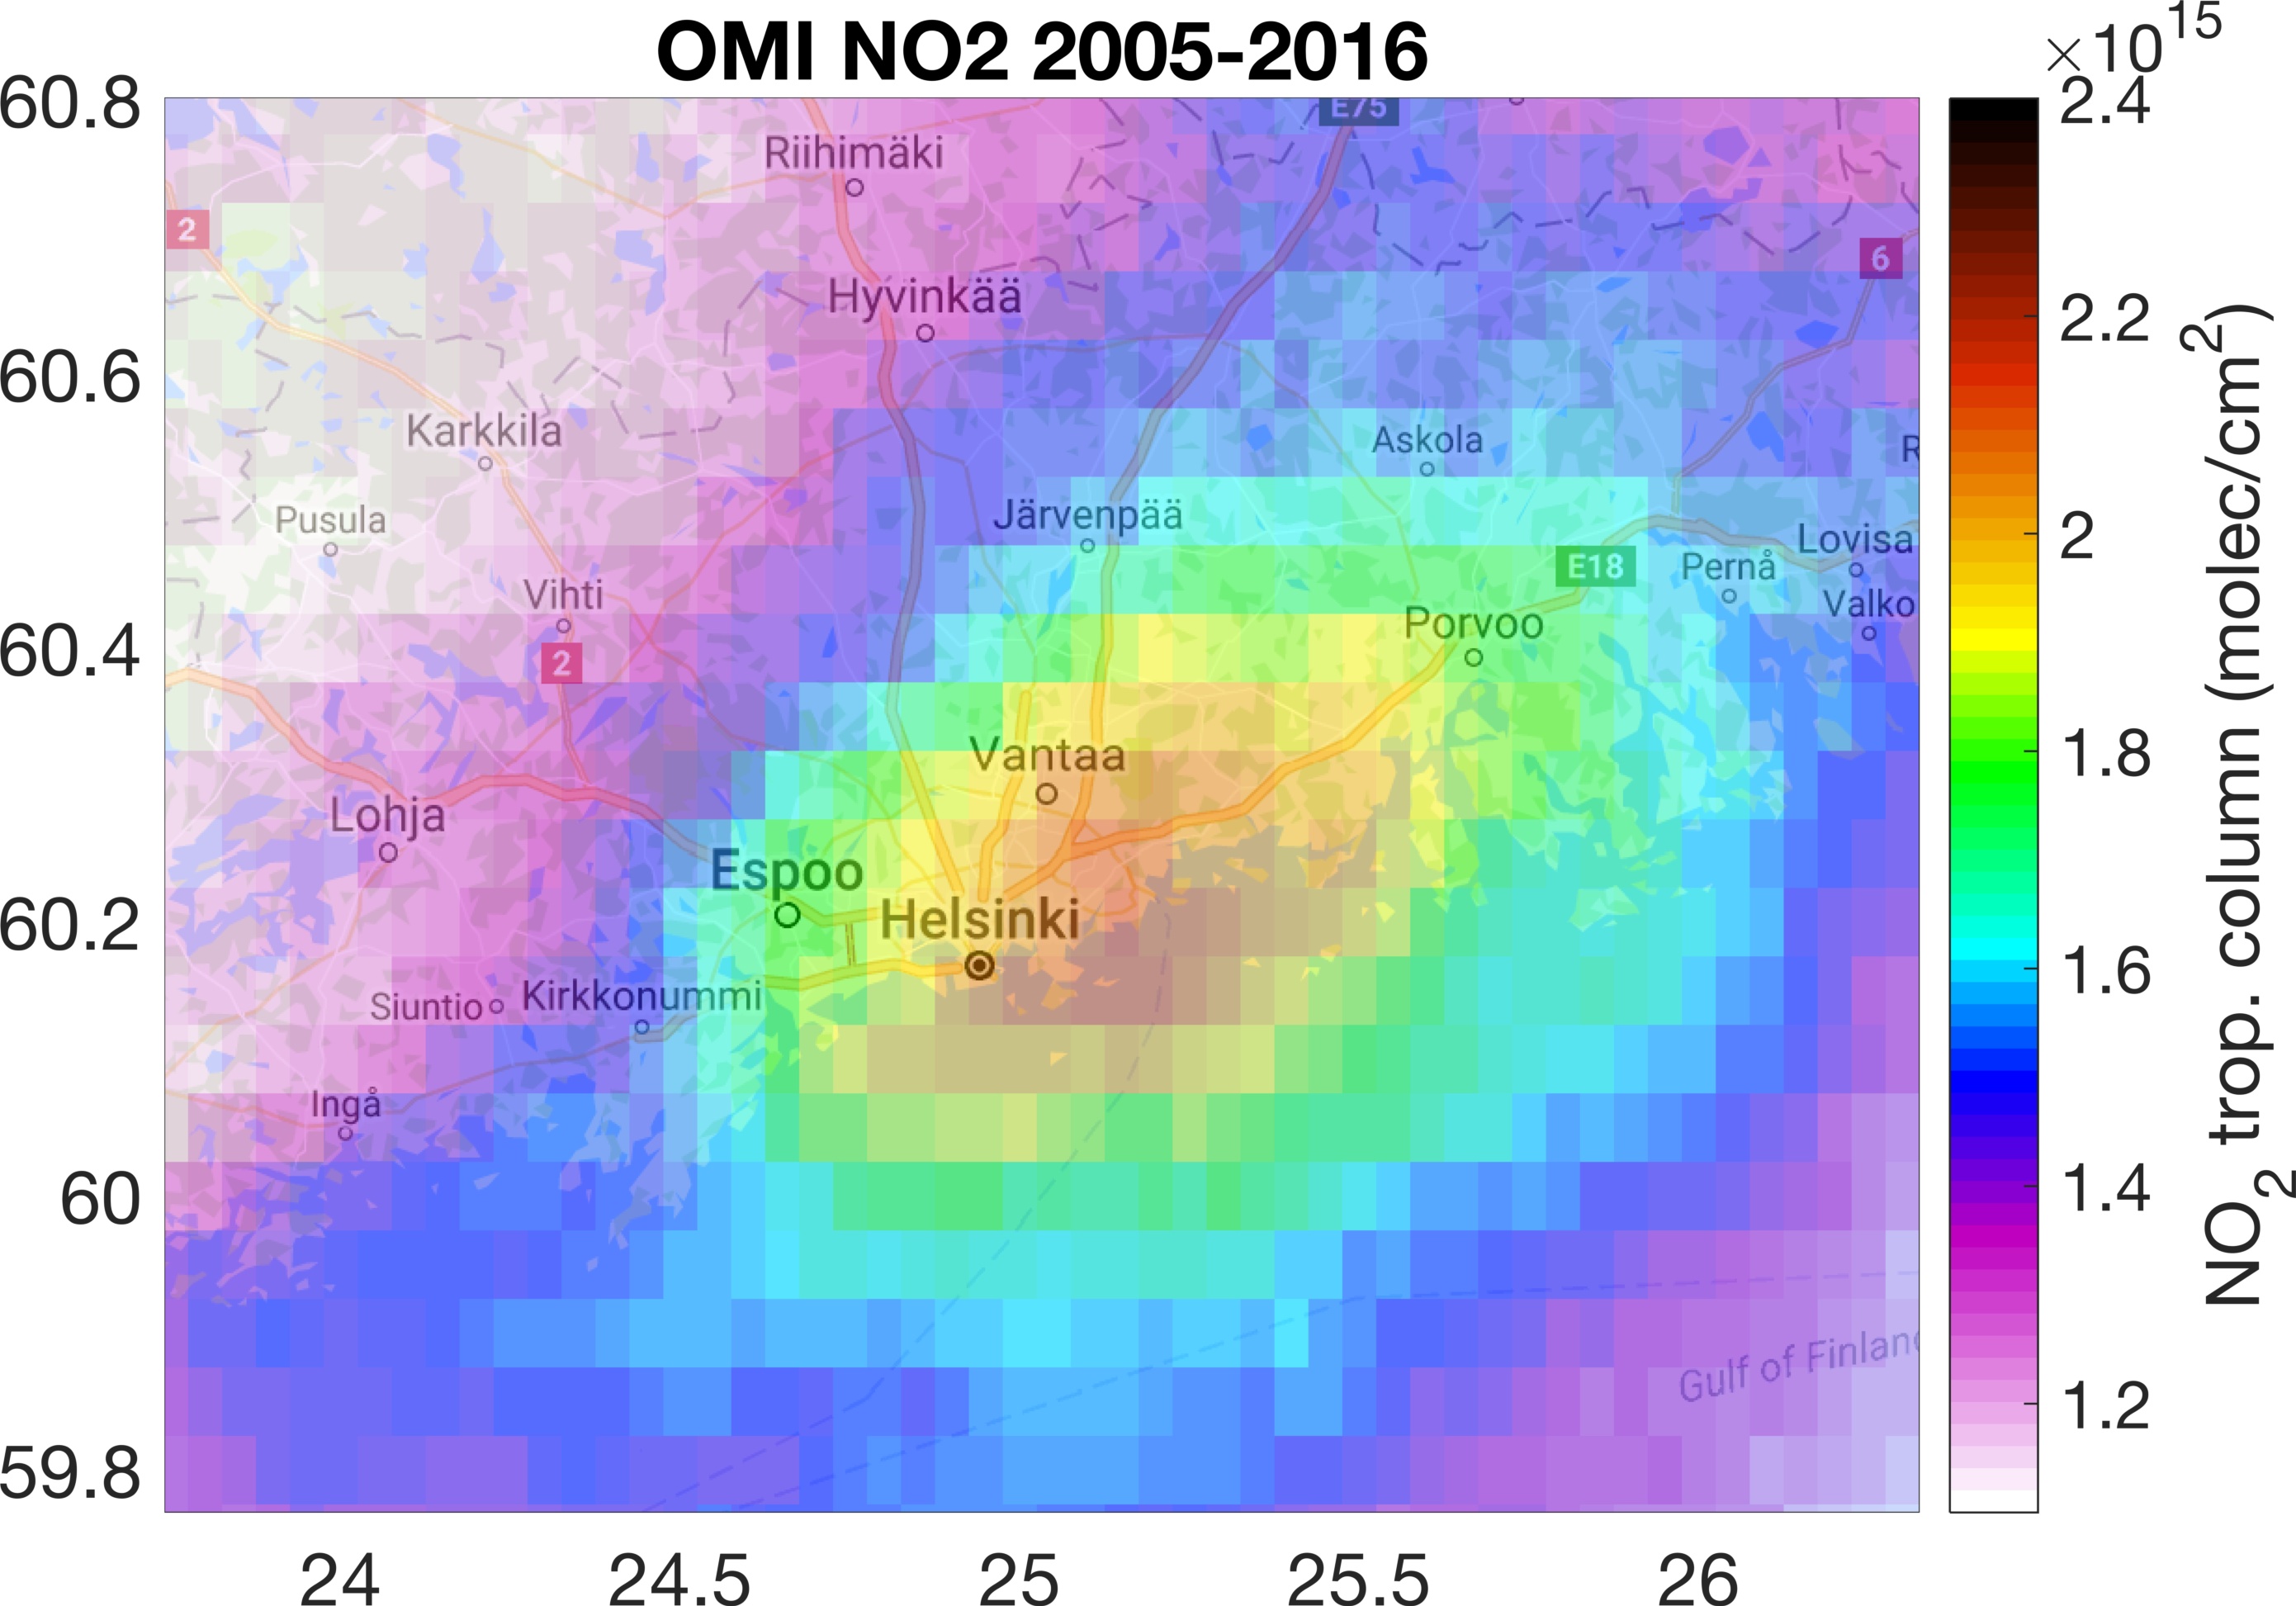
Comparison of air quality levels over Helsinki area during 2005 and 2016. Red color corresponds to higher pollution levels, while yellow-green color to lower pollution levels.

In concomitance with this event, the FMI communication office developed a video collecting examples of satellite expertise at FMI. We had the opportunity to contribute with some results from ILMApilot project. Starting at minute 2:10 of the video you can find several atmospheric monitoring maps. One example is shown in the picture above where the pollution maps (based on OMI NO2 observations) show the air quality improvement observed in the last 12 years over Helsinki area. The area with the highest pollution levels (red color) observed in 2005 becomes sensibly smaller (yellow-green color) in 2016.

ILMApilot aims at improving the use of satellite-based observations in applications serving the Finnish society. Similar maps as shown in the picture above have been used for example by HSY (Helsinki Region Environmental Services Authority) in their yearly air quality report as background information. Satellite-based observations were rarely used in such services before!

Let’s keep in touch for more updates on atmospheric satellite-data applications.

Iolanda

Air quality satellite data for FMI communication to the public

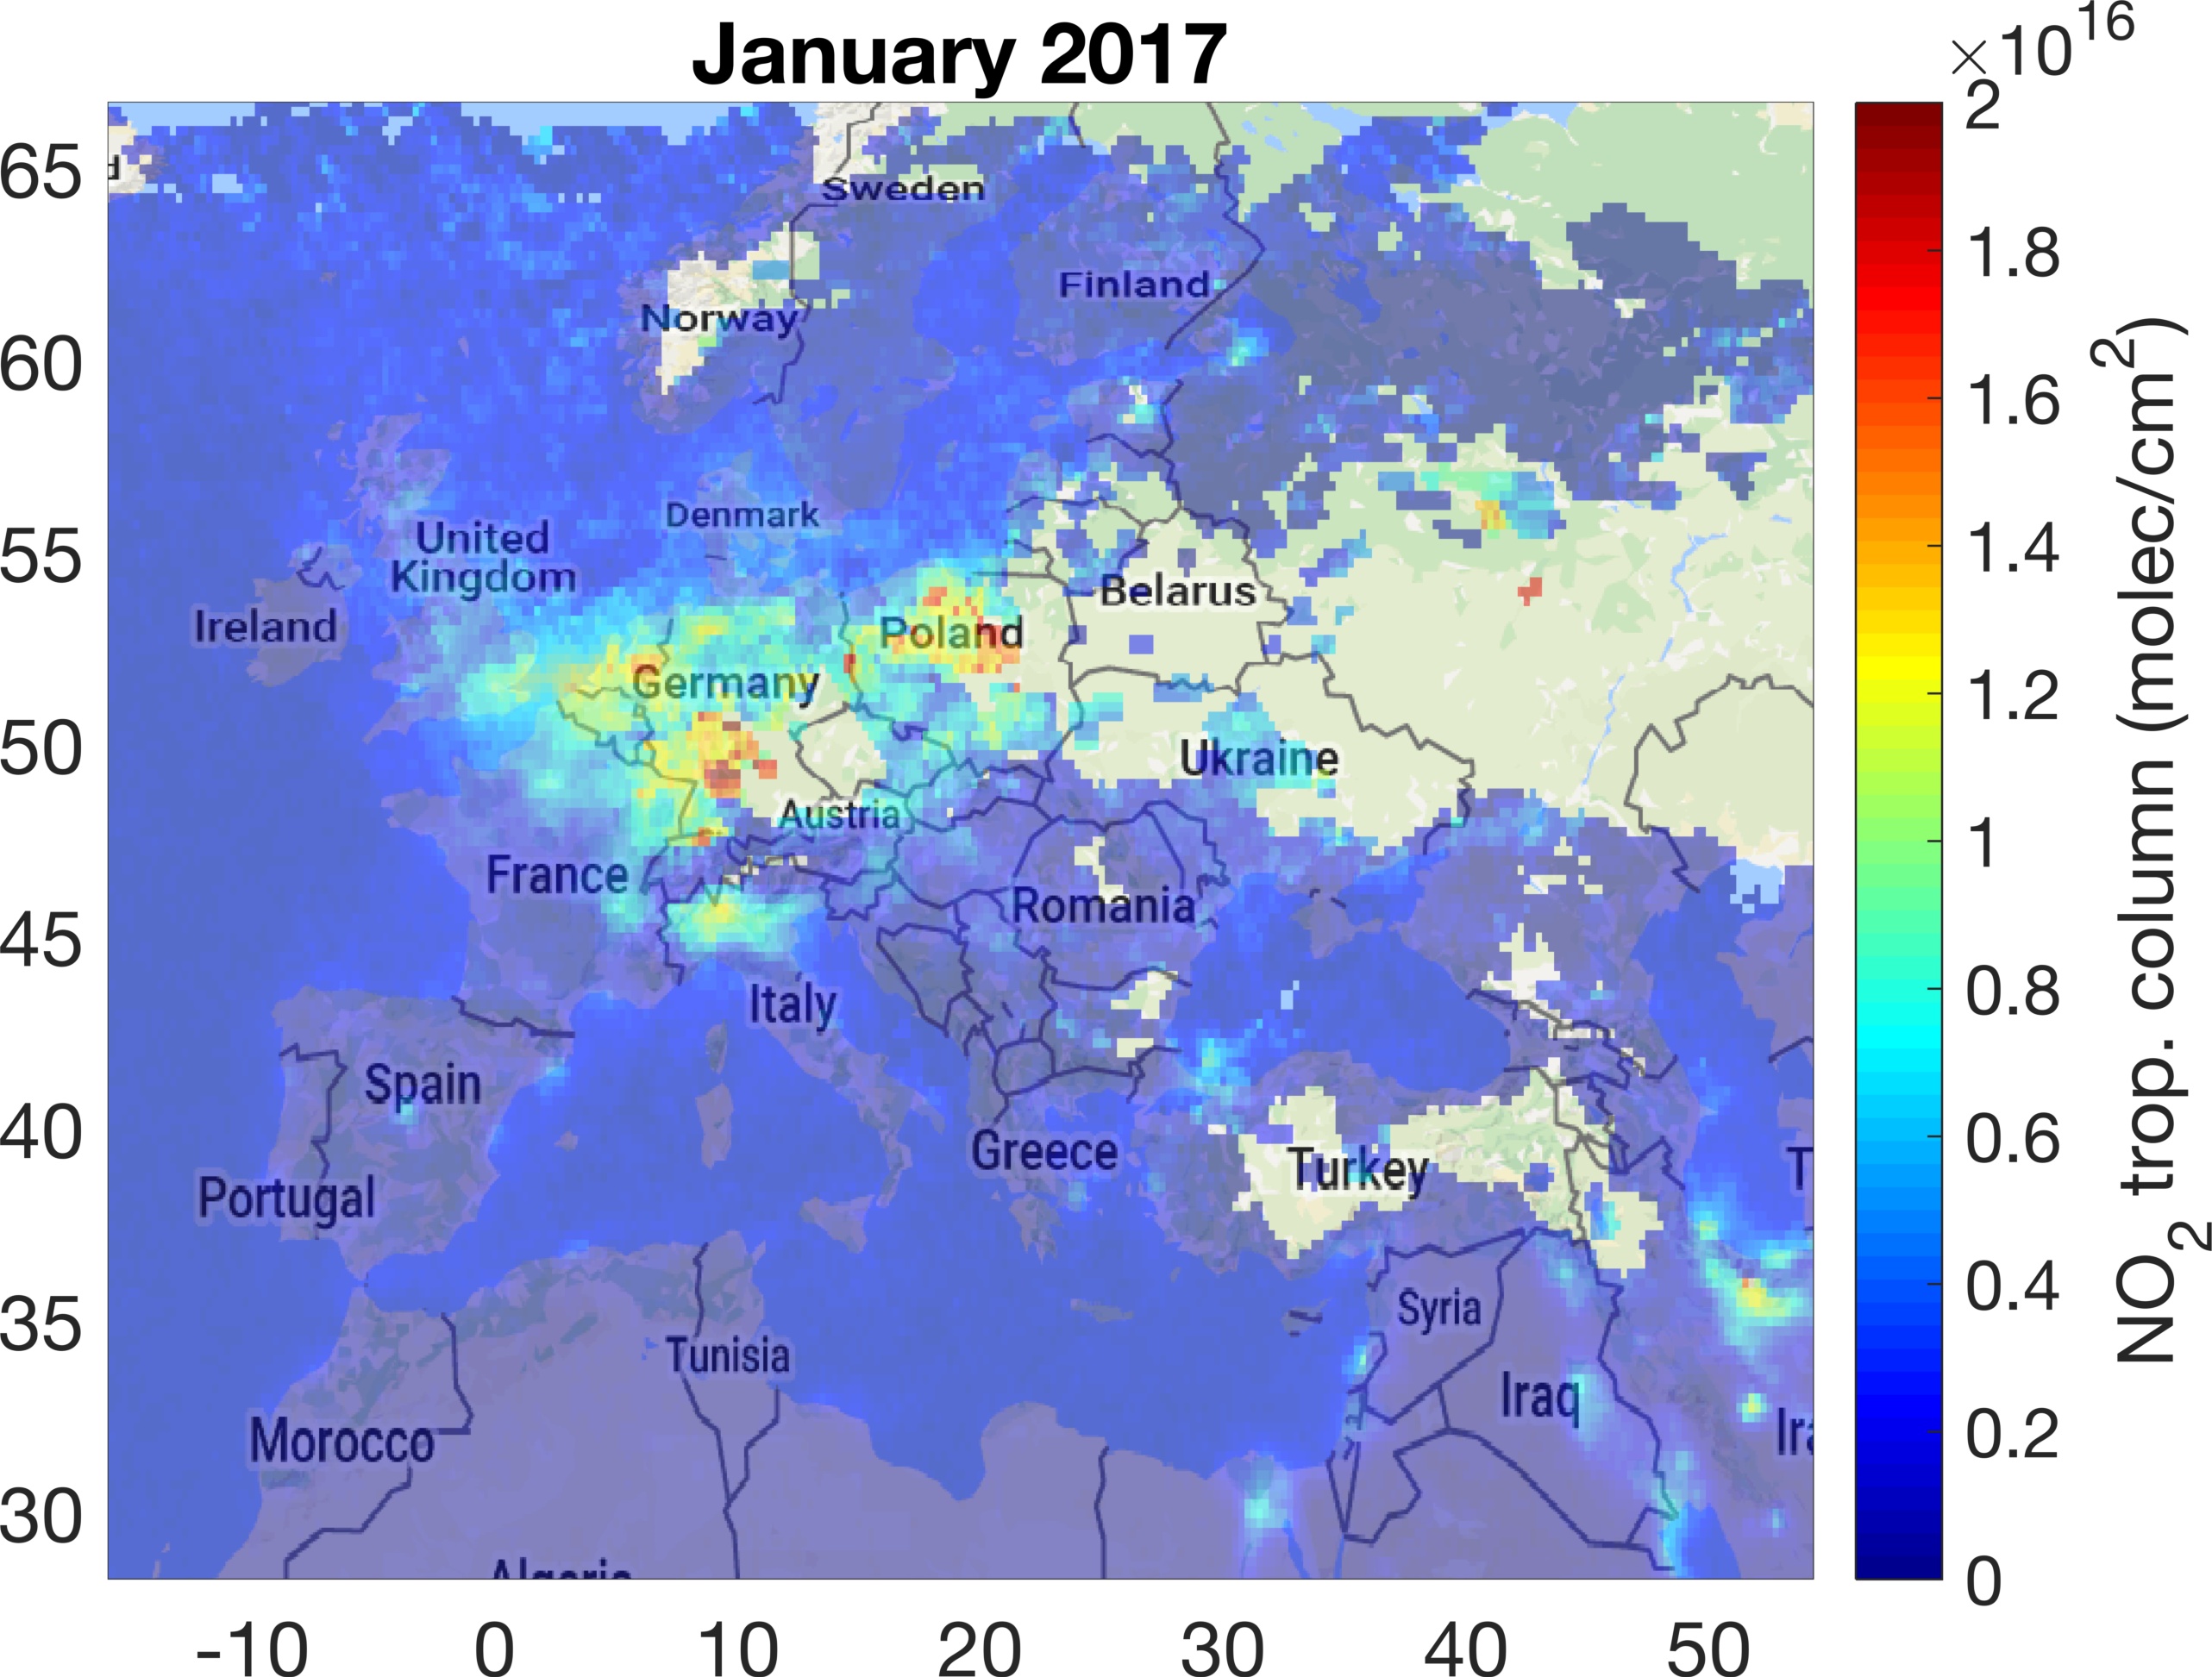
On January 2017 very bad air quality conditions have been experienced over Central Europe. The reasons of such bad air quality levels are related to the weather, which favoured the accumulation of air pollutants in certain areas in Europe. This exceptionally bad air quality conditions were observed also from satellite-based instruments.

Figure 1. Pollution map over Europe in January 2017 from OMI NO2 observations

Satellite-based observations offer the unique capabilities to provide air quality information in one simple map. Figure 1 shows the distribution of nitrogen dioxide (NO2) concentrations during January 2017 as seen from satellite-based retrievals. NO2 is a polluting gas, which is produced in combustion processes for example from car traffic, energy production and industrial activities. The yellow-red colors in fig. 1 correspond to the areas mostly affected by bad air quality. The air quality conditions are especially bad in Germany, Poland and the Netherlands, while the pollution levels in Finland remained relatively low. Currently, the Ozone Monitoring Instrument (OMI) provide the best available product for air quality monitoring on global and local scale.

The communication office at the Finnish Meteorological Institute (FMI) used satellite data to inform the public about the bad air quality conditions over Europe through FMI website and Twitter account.

This is just an example on how satellite data facilitate the communication to the public about air quality issues, using images and visual communication.

Welcome to ILMApilot project


ILMApilot project kicked-off! 

ILMApilot project started in October 2016 with the aim of increasing the societal impact of satellite-based atmospheric observations for air quality monitoring. In particular, ILMApilot focuses on the application of satellite nitrogen dioxide (NO_2) observations for monitoring air quality at high latitudes.

Why are we interested in NO2? NO2 is a pollutant gas produced through fossil fuel combustion. Satellite instruments are able to measure the NO2 content in the atmosphere by using the Sun light. Currently, atmospheric NO2 observations are available from the Dutch-Finnish Ozone Monitoring Instrument (OMI), flying onboard NASA’s Aura satellite since October 2004. Satellite-based data can be used, for example, to provide pollution maps (as shown in the picture above for the Helsinki area) and to find out how the pollution levels change with time. One interesting result was that pollution levels during the weekend are found to be lower than during the rest of the week. These results attracted some attention by the Finnish media as you can read here (well, if you are a Finnish speaker). Also, the Helsinki local environmental authority (HSY) used these maps for their annual air quality report.

Now, we hope to further improve the impact of these results, introducing data from new satellite instruments and involving new collaboration partners.

ILMApilot is funded by the Academy of Finland under the “Key project research funding: Forging ahead with research”. One of the peculiar features of this call is the importance of the interaction between researchers and users as well as the general public. For this reason, traditional dissemination approaches suitable for the scientific community (e.g., scientific publications in peer-reviewed journals or scientific conferences) did not seam to be sufficient. So, here we are! This blog will work as project report as well as direct communication channel to reach a broader audience.

If you are interested on how to improve the impact of scientific research this is the place for you.

Stay in touch!

Iolanda

P.S. You can find some information about me on the section Contact