How can satellite observations help make emissions visible — and support better decision-making?
Author: Janne Hakkarainen
Emission Observatory: Data Economy Spotlight 2026
Happy to share that Emission Observatory has been selected to the Datatalouden kiinnostavimmat – Data Economy Spotlight list!
Link to the platform: https://www.emissionobservatory.org/
Emission Observatory is a satellite-based service developed at the Finnish Meteorological Institute to monitor human-caused greenhouse gas and air pollutant emissions. The service combines open satellite observations with data-driven methods to identify emission sources, quantify emission levels, and track their development over time.
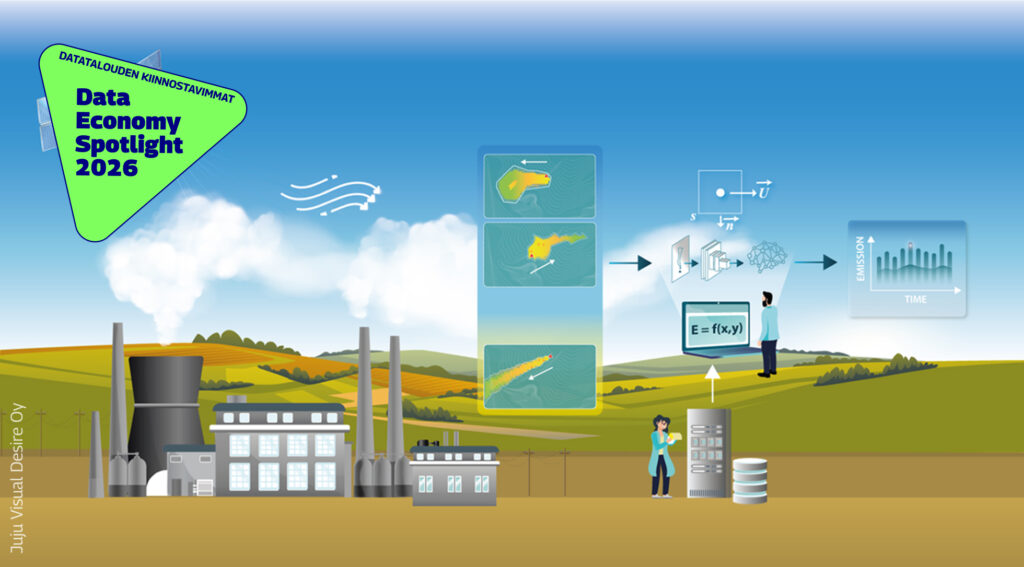
The platform provides transparent and up-to-date emission information, especially for regions where ground-based measurements are limited or unavailable, such as in the African continent.
More info about the spotlight here: https://www.dataspacesalliance.fi/satelliittihavainnot-tuovat-paastot-nakyviin-emission-observatory-vahvistaa-paatoksenteon-tietopohjaa/
Atmospheric observations from space can support security and safety applications
Since April 2023, the civil war in Sudan has caused widespread disruption in the capital region and across the country.
Satellite-based emission estimates reveal a clear signal of these disruptions: NOx emissions over Khartoum and the nearby Al-Jaili industrial complex sharply decreased after the outbreak of the conflict.
Before 2023, two emission hotspots were visible in the Khartoum region: urban emissions from the city and the Al-Jaili industrial complex, located about 60–70 km north of Khartoum and hosting Sudan’s main oil refinery, petrochemical facilities, and the El Jaili thermal power plant. From 2023 onward, a strong decline in NOx emissions can be observed, likely reflecting disruptions to refinery operations, power generation, transportation, and overall urban activity.
Using TROPOMI NO2 observations from the Copernicus Sentinel-5P satellite, we derive NOx emission maps using a data-driven emission estimation approach. These satellite-derived maps highlight major combustion sources such as cities, power plants, and industrial facilities.
Tracking atmospheric pollution from space allows monitoring of critical infrastructure activity and socio-economic disruptions in conflict-affected regions, complementing high-resolution satellite imagery and other Earth observation data for security, safety, and humanitarian applications.
These results are featured on the Emission Observatory platform, which demonstrates through case studies how satellite-based information can be used to monitor emission hotspots.

Data: TROPOMI / Copernicus Sentinel-5P (@European Space Agency – ESA)
Research: @Finnish Meteorological Institute
Funding: @Suomen Akatemia (Academy of Finland) @strateginentutkimus
#EarthObservation #TROPOMI #Sentinel5P #RemoteSensing #AirPollution #SatelliteData #AtmosphericScience #SecurityApplications #ConflictMonitoring #SpaceEconomy #Copernicus #SpaceData
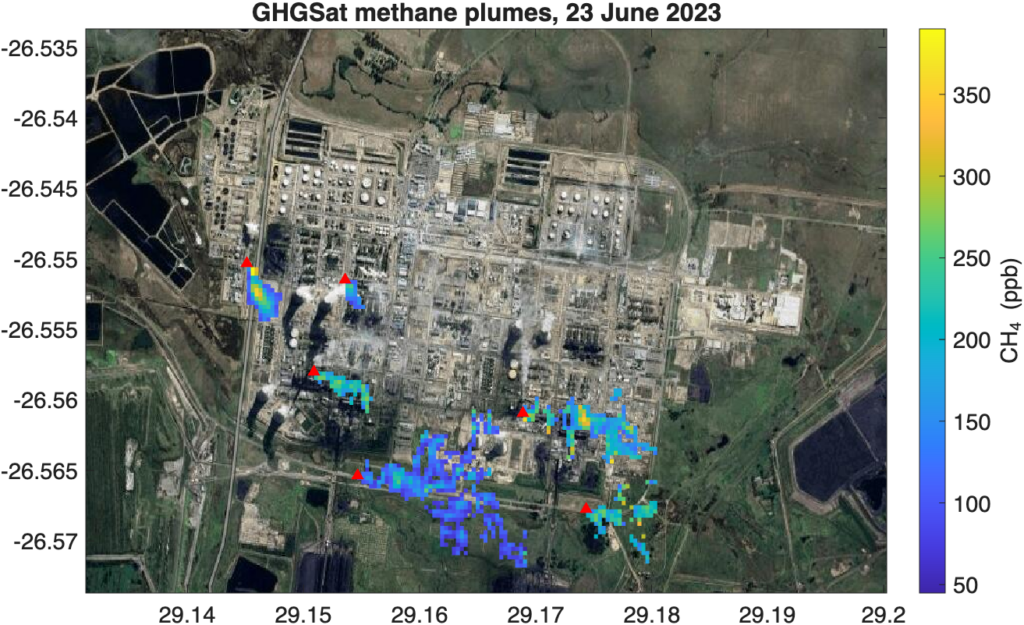
Monitoring Persistent Methane Emissions from the Secunda CTL Synthetic Fuel Plant using S5P and GHGSat Satellite Observations
Reducing global methane emissions is vital in combating climate change. Satellite-based instruments provide a way to independently monitor methane emissions from various sources at different scales, helping to assess the progress toward emission reduction targets. We apply several data-driven methods to estimate methane emissions from the Secunda CTL (coal-to-liquids) synthetic fuel plant in South Africa, utilizing satellite observations from the TROPOspheric Monitoring Instrument (TROPOMI) aboard the Sentinel-5 Precursor (S5P) satellite and the GHGSat fleet of high-resolution commercial satellites. We find annual mean emissions of about 13–22 t/h based on S5P/TROPOMI observations. These results are consistent with estimates from an automated TROPOMI methane plume detection and quantification method. Estimates based on GHGSat observations from individual sources within the plant sum to about 6 t/h, on average. For comparison, Sasol, the operator of the Secunda CTL facility, reported methane emissions of 11.5 t/h for the period July 2023–June 2024, a value that falls between the TROPOMI- and GHGSat-based estimates. Our results highlight the value of satellite observations as a useful audit complementing reported emissions and demonstrate the importance of combining coarse- and fine-resolution data to monitor methane emissions at the plant and intrafacility level in complex sources.
Reference: Henrik Virta, Janne Hakkarainen, Iolanda Ialongo, Johanna Tamminen, Marianne Girard, Berend J. Schuit, and Joannes D. Maasakkers: Monitoring Persistent Methane Emissions from the Secunda CTL Synthetic Fuel Plant using Satellite Observations, Environmental Science & Technology Letters, doi: https://doi.org/10.1021/acs.estlett.5c01140, 2026.
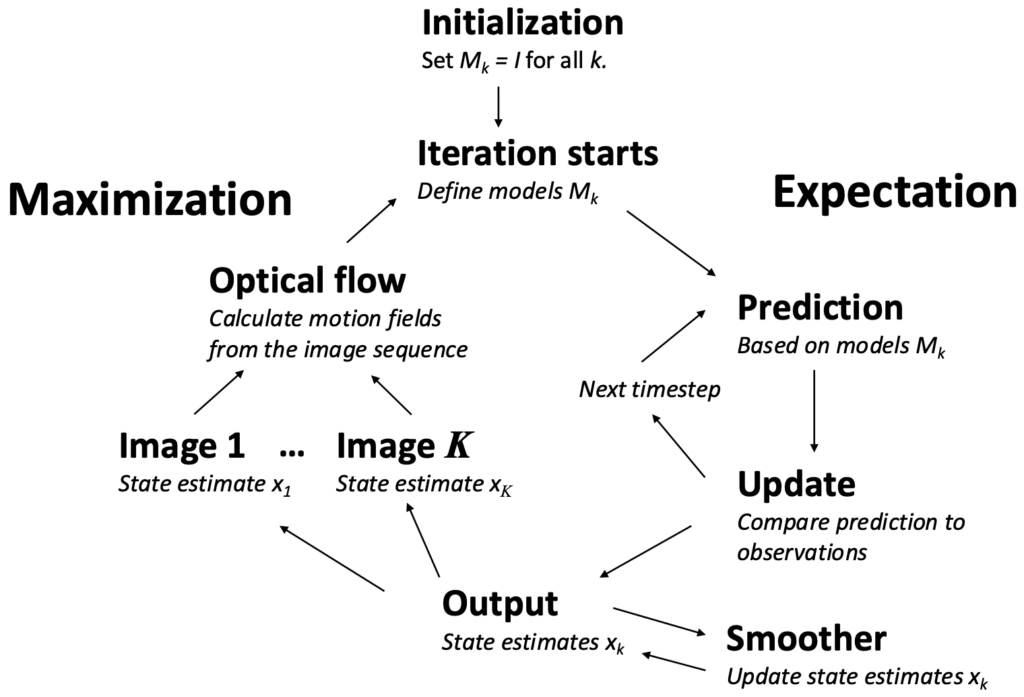
Iterative Filtering and Smoothing with Optical Flow Prediction Models
Our paper, “Iterative Filtering and Smoothing with Optical Flow Prediction Models,” has been published in SIAM Journal on Imaging Sciences.
In this paper, we propose a new data assimilation approach based on iterative filtering and smoothing in the expectation-maximization fashion, incorporating optical flow prediction models for dynamic state estimation. The concept is suitable for applications where state estimation relies on 2D images and where no natural physical prediction model is available. We apply the proposed approach to dynamic X-ray images and both real and synthetic satellite data, demonstrating that iterative filtering and smoothing with optical flow models yields improved results compared to using an identity model approach. The quality of the state estimates improves both visually and in terms of the root mean squared error, typically after a couple of iterations. However, in some cases, continued iterations may lead to deteriorating results. Therefore, monitoring the quality of both optical flow and state estimates is crucial in the iterative approach.
Citation:
Janne Hakkarainen, Zenith Purisha, Neus Sabater, Monika Szeląg, Samuli Siltanen and Antti Solonen: Iterative Filtering and Smoothing with Optical Flow Prediction Models, SIAM Journal on Imaging Sciences, Volume 18, Number 4, doi:10.1137/24M1689120, 2025. https://epubs.siam.org/doi/full/10.1137/24M1689120
New Satellite-based Methods for Monitoring Emissions from Cities and Power Stations
Satellites have proven to be a powerful tool for monitoring individual emission sources from space. Recent research highlights the significant potential of satellite data to reveal previously unreported or underestimated emissions, especially in regions where official emission inventories are delayed or incomplete.
Tracking emissions from cities, power stations, and other major sources is critical for understanding and addressing climate change. In 2025, the Finnish Meteorological Institute (FMI) developed two new methods to estimate emissions using satellite observations.
Two New Satellite-Based Methods
1. Using Nitrogen Dioxide (NO₂) to Estimate CO₂ Emissions
The first method leverages satellite measurements of nitrogen dioxide (NO₂), a gas often emitted alongside carbon dioxide (CO₂), to improve CO₂ emission estimates. Using this technique, researchers found that emissions from the Matimba and Medupi power plants in South Africa were significantly underestimated in official inventories—likely because emissions from the newer Medupi plant are missing altogether. Similar gaps were found in the emissions data for cities like Baghdad, while inventories for cities in Western countries, such as Madrid and Las Vegas, were found to be more accurate.
2. LIME: Linear Integrated Mass Enhancement
The second method, called LIME (Linear Integrated Mass Enhancement), estimates emissions by analyzing how the mass of a gas plume increases linearly with distance from the source. This approach has been useful for example calculating methane emissions from industrial sites and gas leaks. It has already been applied to detect methane releases in Algeria and South Africa using two different satellite instruments.
Both methods contribute to the FMI’s Emission Observatory, an open-access web service that compiles emission data from individual sources such as cities and power plants—focusing especially on under-monitored regions like Africa.
The research was conducted in collaboration with leading international experts and supported by the Research Council of Finland.
Technical papers:
Janne Hakkarainen, Iolanda Ialongo, Tomohiro Oda, and David Crisp: A robust method for calculating carbon dioxide emissions from cities and power stations using OCO‐2 and S5P/TROPOMI observations, Journal of Geophysical Research: Atmospheres, Volume 130, 2025, https://doi.org/10.1029/2025JD043358.
Janne Hakkarainen, Iolanda Ialongo, Daniel J. Varon, Gerrit Kuhlmann, and Maarten C. Krol: Linear Integrated Mass Enhancement: A method for estimating hotspot emission rates from space-based plume observations, Remote Sensing of Environment, Volume 319, 2025, https://doi.org/10.1016/j.rse.2025.114623
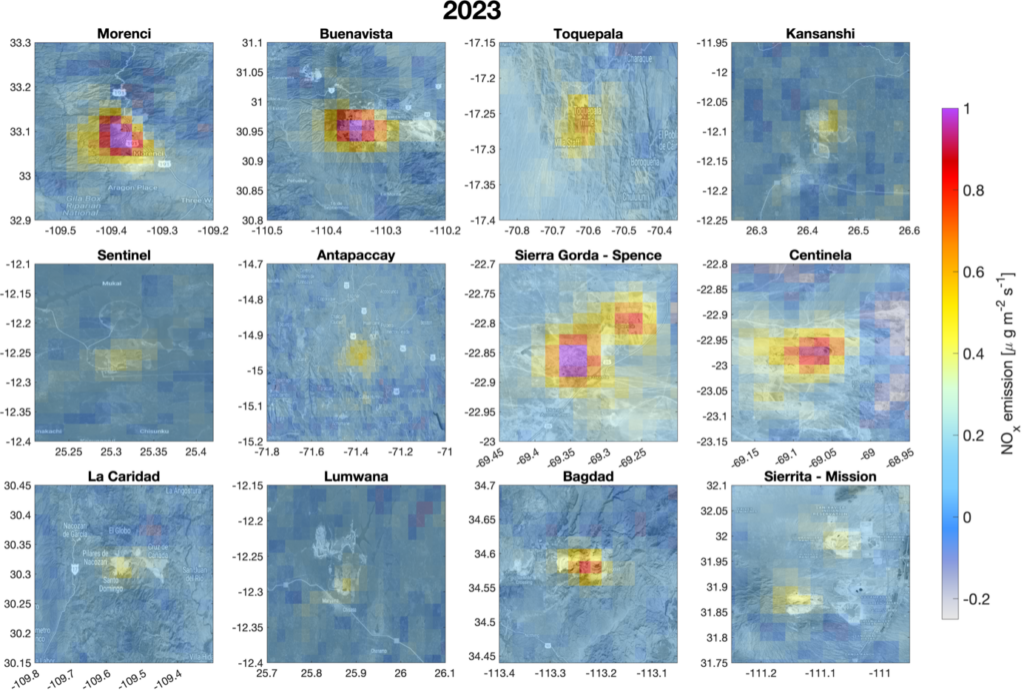
Satellites reveal air pollution from the world’s largest copper mines
Satellite observations highlight nitrogen oxide emissions coupled with copper production
Copper plays a crucial role in the global transition to a sustainable economy, serving as a key component in electric vehicles, solar panels, and wind turbines. However, copper mining also poses environmental and social challenges that must be addressed responsibly. Assessing the mining industry’s performance and environmental impact is essential for tracking progress toward sustainable development.
A new study, published in Environmental Research Letters, utilizes satellite observations of nitrogen dioxide (NO2) to estimate nitrogen oxide (NOx) emissions over 14 of the world’s largest open-pit copper mines. The monitored sites include major copper mines in the United States, Chile, Peru, Mexico, and Zambia. The emissions mostly originate from the diesel-powered mobile fleet operating over the mines. The highest emissions were observed at the Morenci copper mine in Arizona, USA. The study found that NOx emissions are rising at many sites, particularly in South America. In contrast, emissions in the Zambian mines appear to be declining, likely due to increased electrification of mining equipment. The emissions increase with increasing copper production and moved material volumes.
With growing pressure for the mining industry to align with environmental, social, and governance (ESG) principles, independent monitoring is crucial. “Currently, most sustainability reporting in the mining sector relies on self-disclosures by companies, which can be inconsistent and incomplete. Satellite observations provide an independent, timely, and transparent way to track emissions,” explains Dr. Iolanda Ialongo, senior researcher and lead author of the study.
Satellite observations can also detect sudden changes in mining operations, such as shifts in fossil fuel usage due to fleet electrification, thereby supporting emission reduction strategies. Satellite-based assessments are especially valuable in regions lacking other monitoring systems, offering actionable data for environmental authorities, non-governmental organizations, and local communities.
REFERENCE
Ialongo I., Virta H., Hakkarainen J., Özcan C., Ranta M., and Zieleniewski S. (2025): Unveiling nitrogen oxide emissions from open-pit copper mines through satellite observations, Environ. Res. Lett. 20 034041 https://doi.org/10.1088/1748-9326/adb767
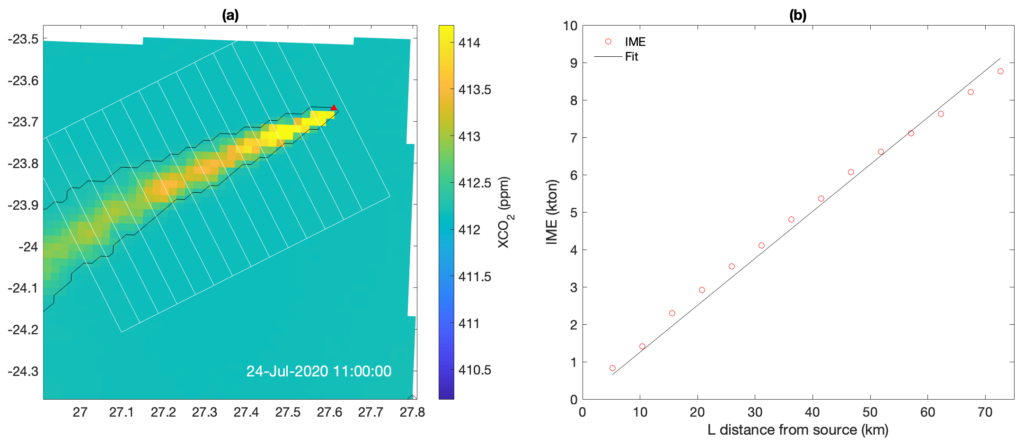
Linear Integrated Mass Enhancement
Our paper, “Linear Integrated Mass Enhancement: A method for estimating hotspot emission rates from space-based plume observations,” has been published in Remote Sensing of Environment.
In this paper, we propose a new methodology for plume inversion emission estimation termed linear integrated mass enhancement (LIME). As the name implies, this approach is based on the integrated mass enhancement (IME) method and on the linear relationship between IME and the distance from the source. The proposed approach accounts for the information coming from different portions of the plume, and it can be seen as a “combination” of the cross-sectional flux (CSF) method and IME. The method offers a straightforward way to estimate the source strength by determining the slope of the linear fit.
We test the LIME approach with both real (OCO-3, S5P/TROPOMI, Sentinel-2) and simulated (MicroHH, SMARTCARB) satellite data. We apply the method to the simulated carbon dioxide (CO2) observations for the upcoming CO2M mission over the Matimba and Jänschwalde power stations with known source rates. We use the OCO-3 data to estimate the CO2 emissions originating from the Bełchatów power station in Poland (between 72 and 103 ktCO2/d). We also estimate the emissions from two methane (CH4) leaking sites in Algeria based on S5P/TROPOMI (77 and 47 tCH4/h for two days) and Sentinel-2 (7.7 tCH4/h) observations. Finally, we apply the LIME method to the Sentinel-2 retrievals from a controlled CH4 release in Arizona.
Across all case studies, the LIME emission estimates are in agreement with the expected values. The LIME estimates are also aligned with the state-of-the-art IME emission estimates, which are calculated as byproducts in the LIME emission estimation process.
Citation:
Janne Hakkarainen, Iolanda Ialongo, Daniel J. Varon, Gerrit Kuhlmann, and Maarten C. Krol: Linear Integrated Mass Enhancement: A method for estimating hotspot emission rates from space-based plume observations, Remote Sensing of Environment, Volume 319, 2025, https://doi.org/10.1016/j.rse.2025.114623.
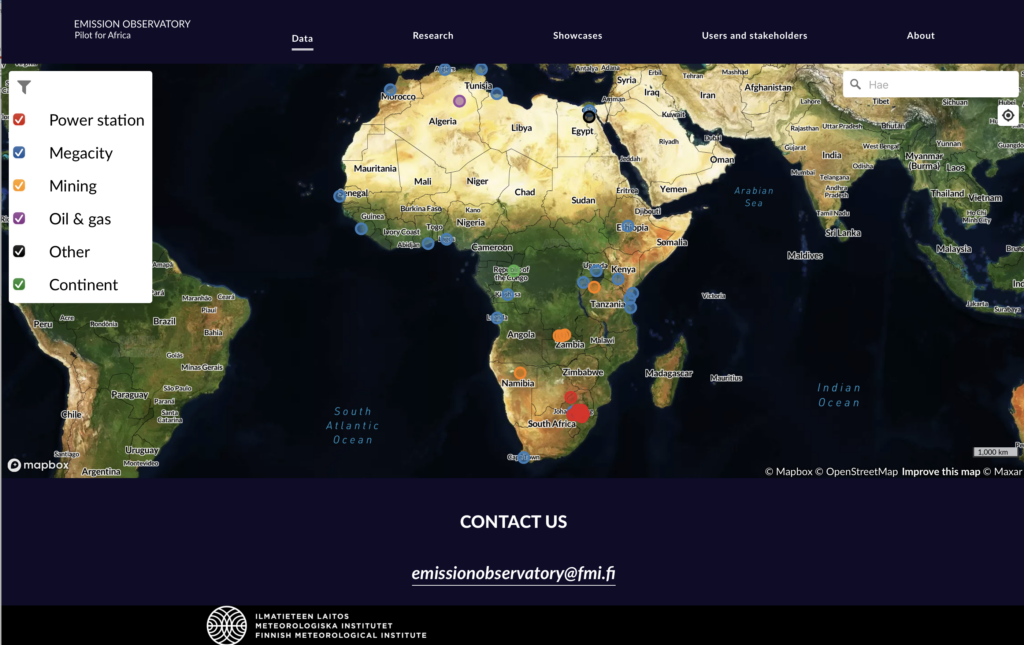
Emission Observatory – Pilot for Africa
Climate change, driven by increasing atmospheric concentrations of anthropogenic greenhouse gases (GHGs), is one of the greatest threats of our time. Space-based observations offer new opportunities for improving the completeness and transparency of emission reports as they provide objective observations over areas where other information is inaccurate or not available.
Over the past decade, satellite-based measurements of greenhouse gases have transformed the estimation of emission rates from anthropogenic hotspots. New satellite observations of emission plumes from point sources have created opportunities to use simpler and more computationally efficient methods for estimating emissions. International accords like the 2015 Paris Agreement have played a major role in driving research in this area. Many space agencies, organizations, and private companies are now developing new GHG satellite missions and constellations to observe plumes and support future monitoring of GHG emissions.
To obtain emission estimates from atmospheric concentrations, mathematical inverse modeling methods are needed. The Finnish Meteorological Institute is dedicated to developing new methods for data-driven emission estimation that do not require complex atmospheric modeling. In particular, the team has developed several new plume inversion techniques for various recent satellite missions. As part of user engagement activities, the team has piloted a new service for the African continent, where ground-based information has traditionally been less available.
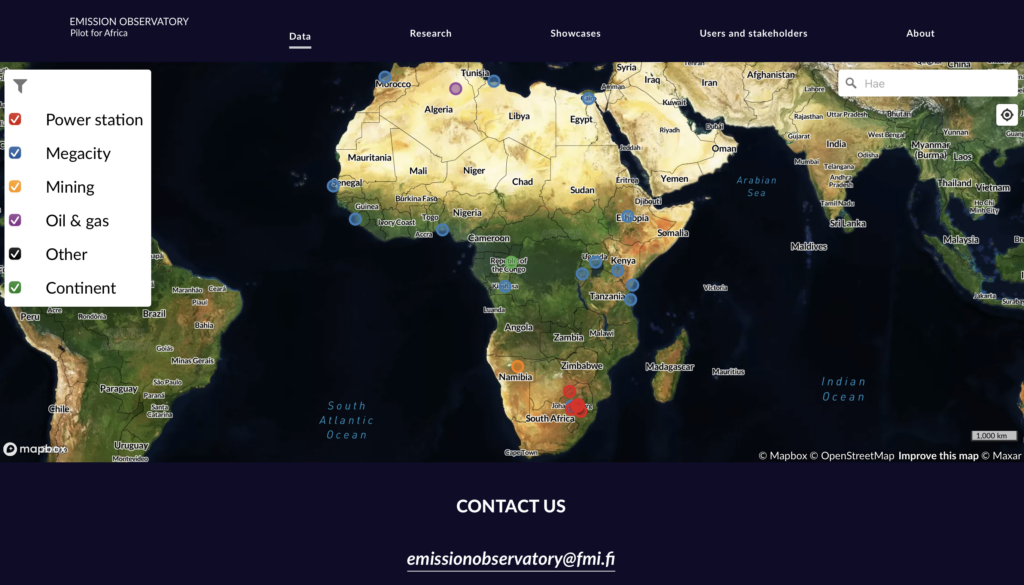
The Emission Observatory – Pilot for Africa platform is an interactive map service for monitoring anthropogenic GHG and air pollution hotspots in Africa using satellite observations and state-of-the-art emission estimation methods. Specific focus areas include cities and megacities, the mining sector (particularly critical minerals needed for the green transition), energy production (e.g., power plants in South Africa’s Highveld region), and the oil and gas industry (especially regarding fugitive methane emissions and gas flaring). The service is set to inform decision makers, environmental authorities, citizens and industry about emission sources and their spatio-temporal variability, specifically over the African continent. The information provided through the platform are tailored to the users’ needs and feedback. The platform is based on publicly available observations from the EU’s Copernicus Sentinel fleet and NASA’s Earth observation program.
User and stakeholders of the Emission Observatory – Pilot for Africa service can engage and participate in the service implementation through a co-design process.
If you are interested in and would like to benefit from this service and methods, please contact us: emissionobservatory@fmi.fi
Link to the service: https://www.emissionobservatory.org
Analyzing nitrogen dioxide to nitrogen oxide scaling factors for data-driven satellite-based emission estimation methods
Highlights
- NO2 to NOx scaling factors calculated from the MicroHH large-eddy simulations.
- Optimal scaling factors depend on the emission inversion method.
- Scaling factors applied to derive NOx emissions from S5P/TROPOMI NO2 observations.
- Optimal scaling factors are substantially higher than the values previously used.
We have a new paper in Atmospheric Pollution Research!
In this paper, we propose improved nitrogen dioxide (NO2) to nitrogen oxide (NOx) scaling factors for several data-driven methods that are used for the estimation of NOx power plant emissions from satellite observations of NO2. The scaling factors are deduced from high-resolution simulations of power plant plumes with the MicroHH large-eddy simulation model with a simplified chemistry and then applied to Sentinel-5 Precursor (S5P) TROPOspheric Monitoring Instrument (TROPOMI) NO2 satellite observations over the Matimba/Medupi power stations in South Africa.
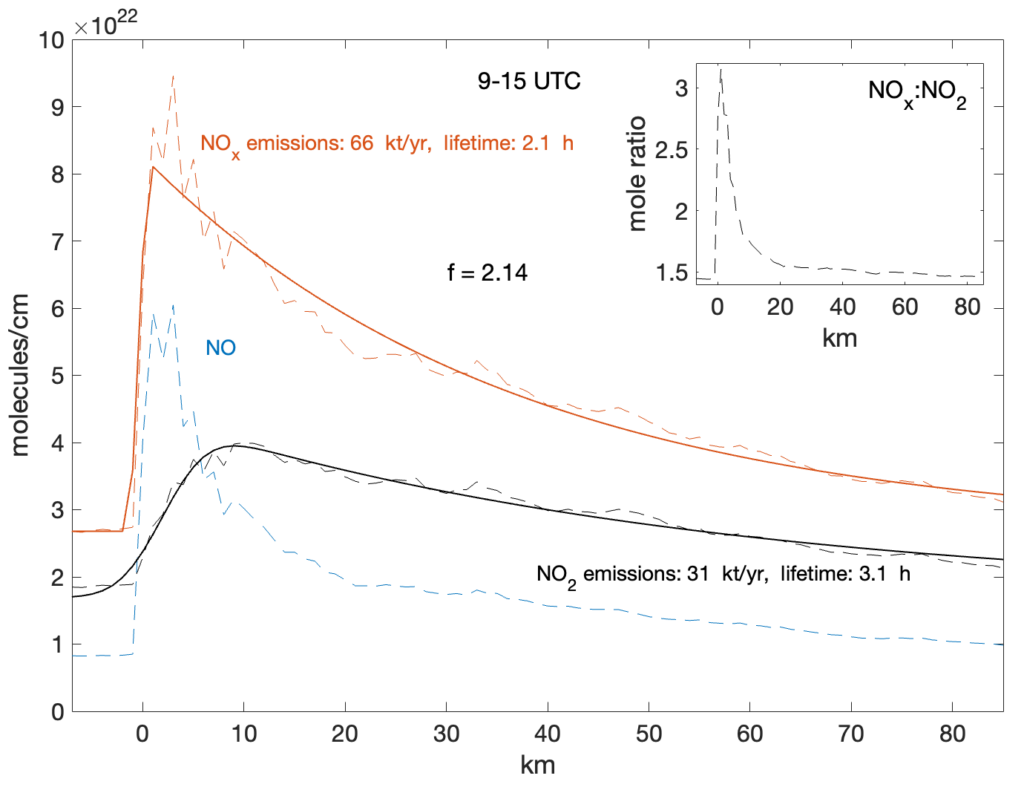
In this new paper, we show that due to the non-linear chemistry the optimal NO2 to NOx scaling factors depend on both the method employed and the specific segments of the plume from which emission estimate is derived. The scaling factors derived from the MicroHH simulations in this study are substantially (more than 50%) higher than the typical values used in the literature with actual NO2 observations. The results highlight the challenge in appropriately accounting for the conversion from NO2 to NOx when estimating point source emissions from satellite NO2 observations.
Reference
Janne Hakkarainen, Gerrit Kuhlmann, Erik Koene, Diego Santaren, Sandro Meier, Maarten C. Krol, Bart J.H. van Stratum, Iolanda Ialongo, Frédéric Chevallier, Johanna Tamminen, Dominik Brunner, Grégoire Broquet,: Analyzing nitrogen dioxide to nitrogen oxide scaling factors for data-driven satellite-based emission estimation methods: a case study of Matimba/Medupi power stations in South Africa, Atmospheric Pollution Research, Volume 15, Issue 7, https://doi.org/10.1016/j.apr.2024.102171, 2024.