ILMApilot results featured in the expanded Arctic Space Center opening.
Last week we celebrated the opening of the expanded Arctic Space Center at the Finnish Meteorological Institute in Sodankylä and the inauguration of a new reception antenna. This extends the capability to receive atmospheric and surface data from several satellites and enable various applications based on such information. The event included the contribution from several speakers and our OMI (Ozone Monitoring Instrument) work got a really nice shout-out by the KNMI general manager. You can watch the full event here. The event happens on the same year Finland celebrates its 100th birthday and starts the chairmanship of the Arctic Council.
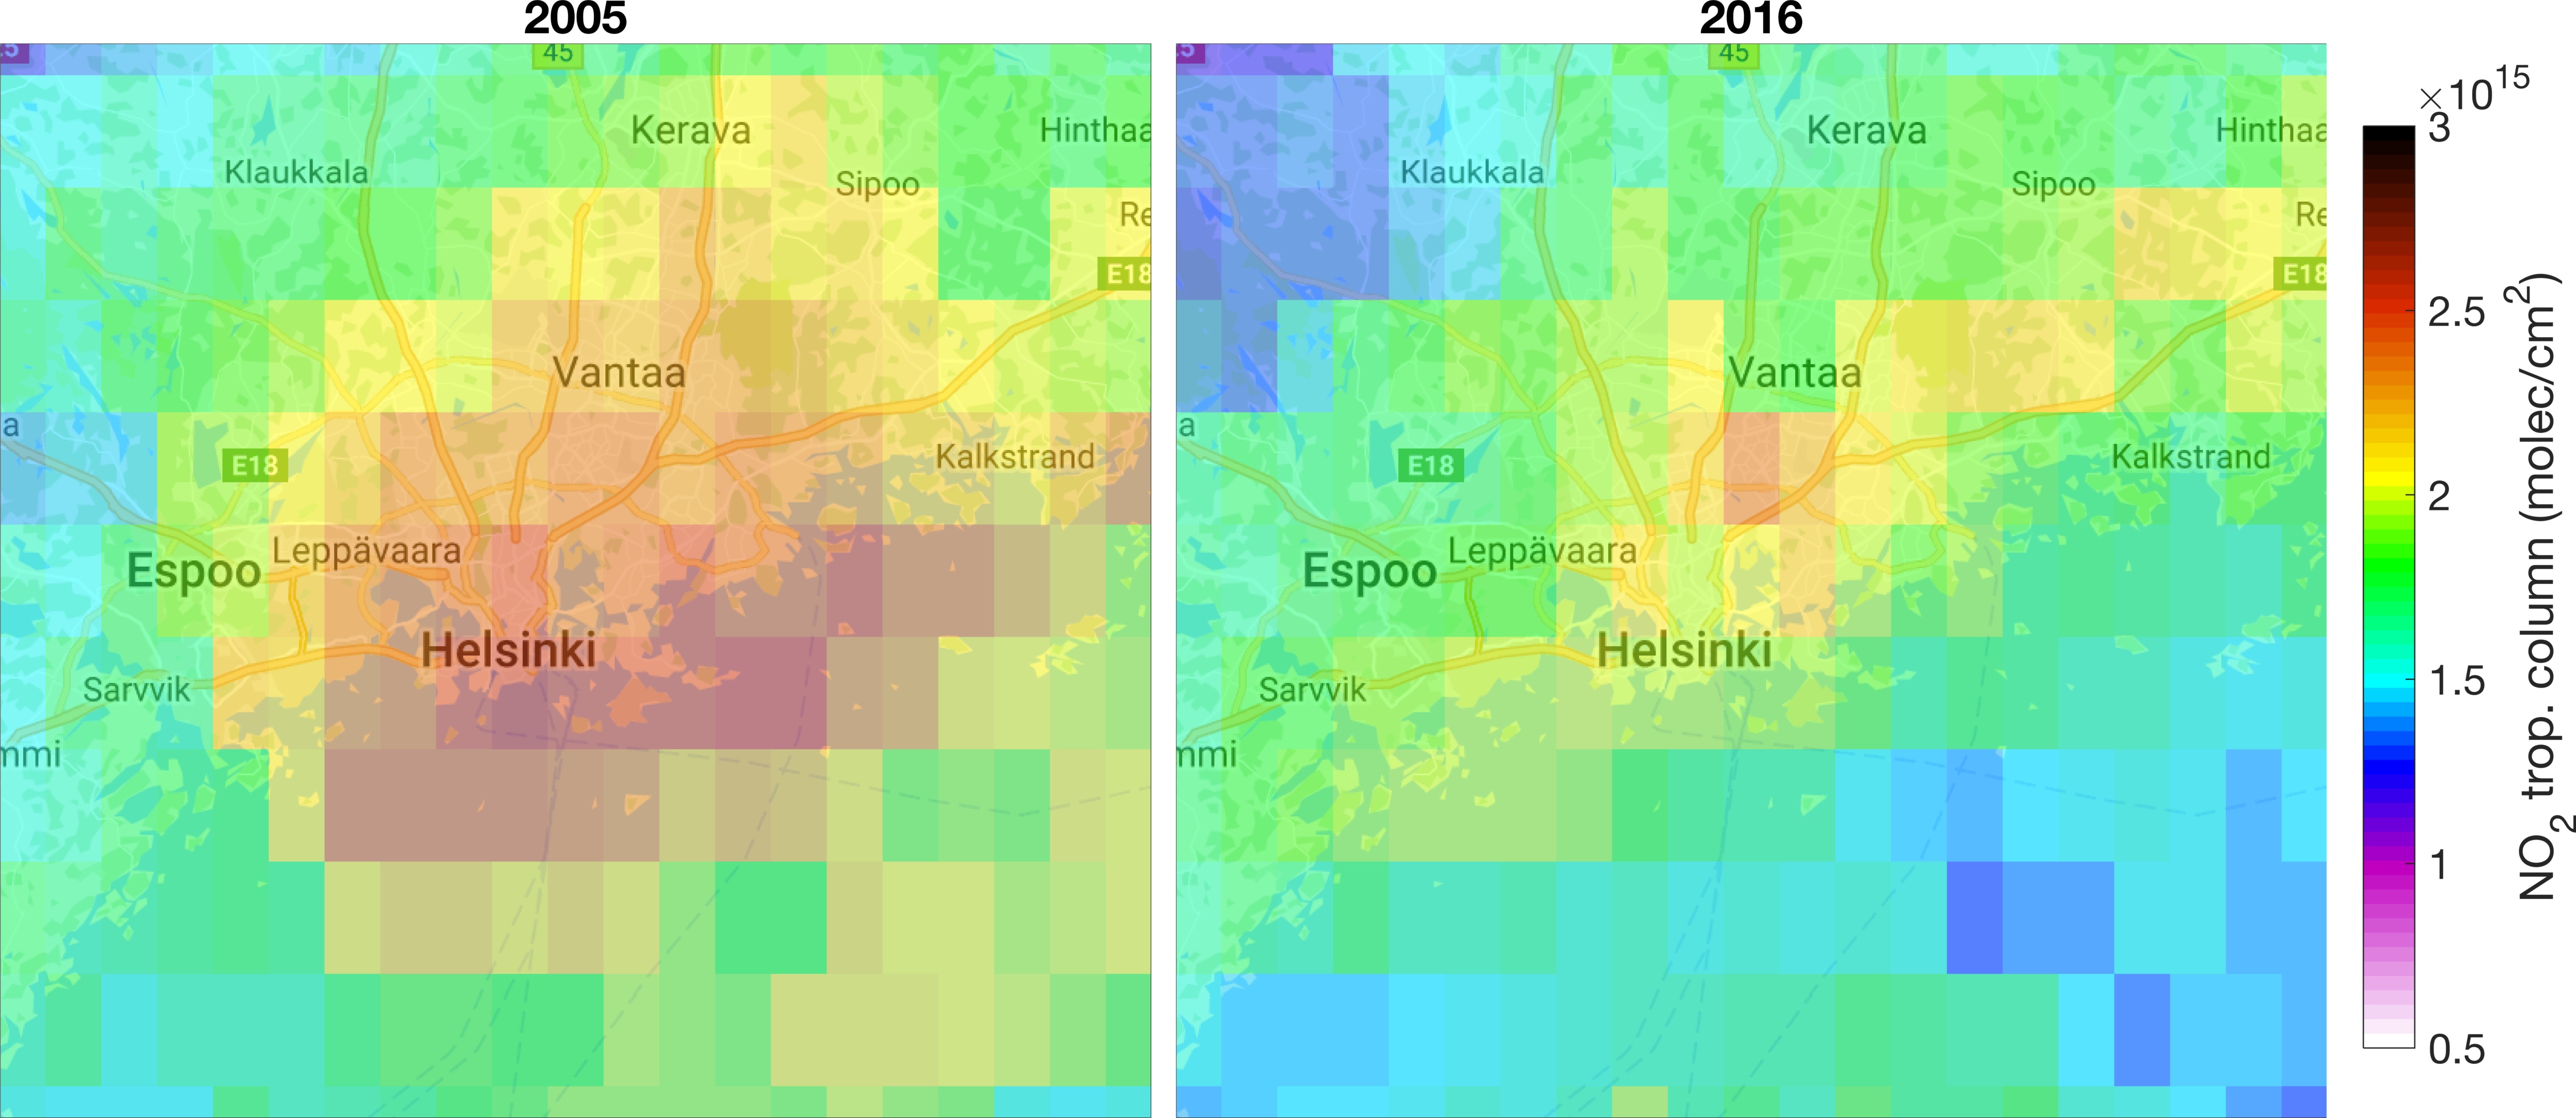
In concomitance with this event, the FMI communication office developed a video collecting examples of satellite expertise at FMI. We had the opportunity to contribute with some results from ILMApilot project. Starting at minute 2:10 of the video you can find several atmospheric monitoring maps. One example is shown in the picture above where the pollution maps (based on OMI NO2 observations) show the air quality improvement observed in the last 12 years over Helsinki area. The area with the highest pollution levels (red color) observed in 2005 becomes sensibly smaller (yellow-green color) in 2016.
ILMApilot aims at improving the use of satellite-based observations in applications serving the Finnish society. Similar maps as shown in the picture above have been used for example by HSY (Helsinki Region Environmental Services Authority) in their yearly air quality report as background information. Satellite-based observations were rarely used in such services before!
Let’s keep in touch for more updates on atmospheric satellite-data applications.
Iolanda