This week I’m in Vienna at the EGU (European Geosciences Union) General Assembly. It is the largest European gathering of scientists in the field of geosciences. Tomorrow I’ll give a talk about mapping anthropogenic CO2 emission areas using satellite-based observations. CO2 (carbon dioxide) is the most important anthropogenic greenhouse gas and it’s produced mostly by fossil fuel combustion.
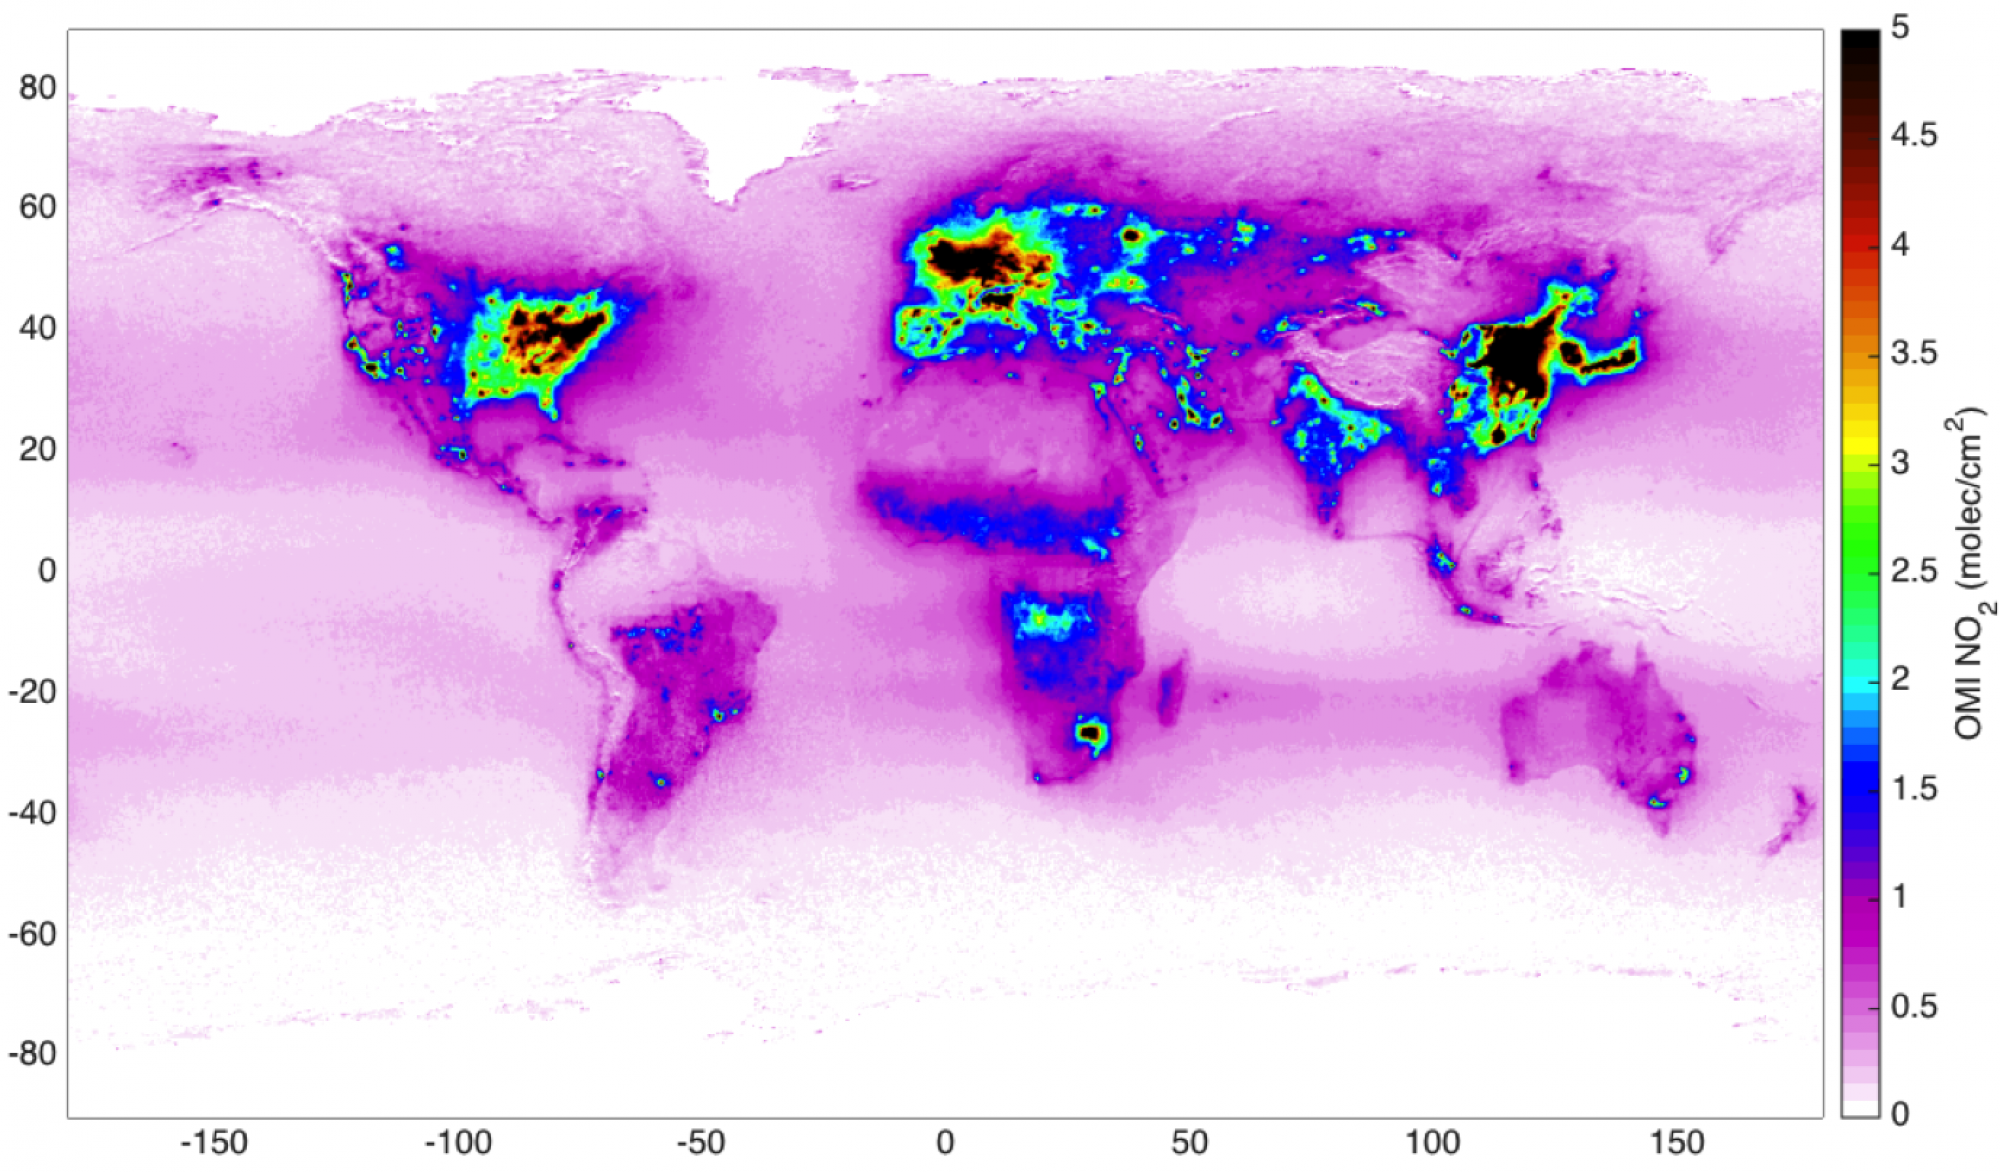
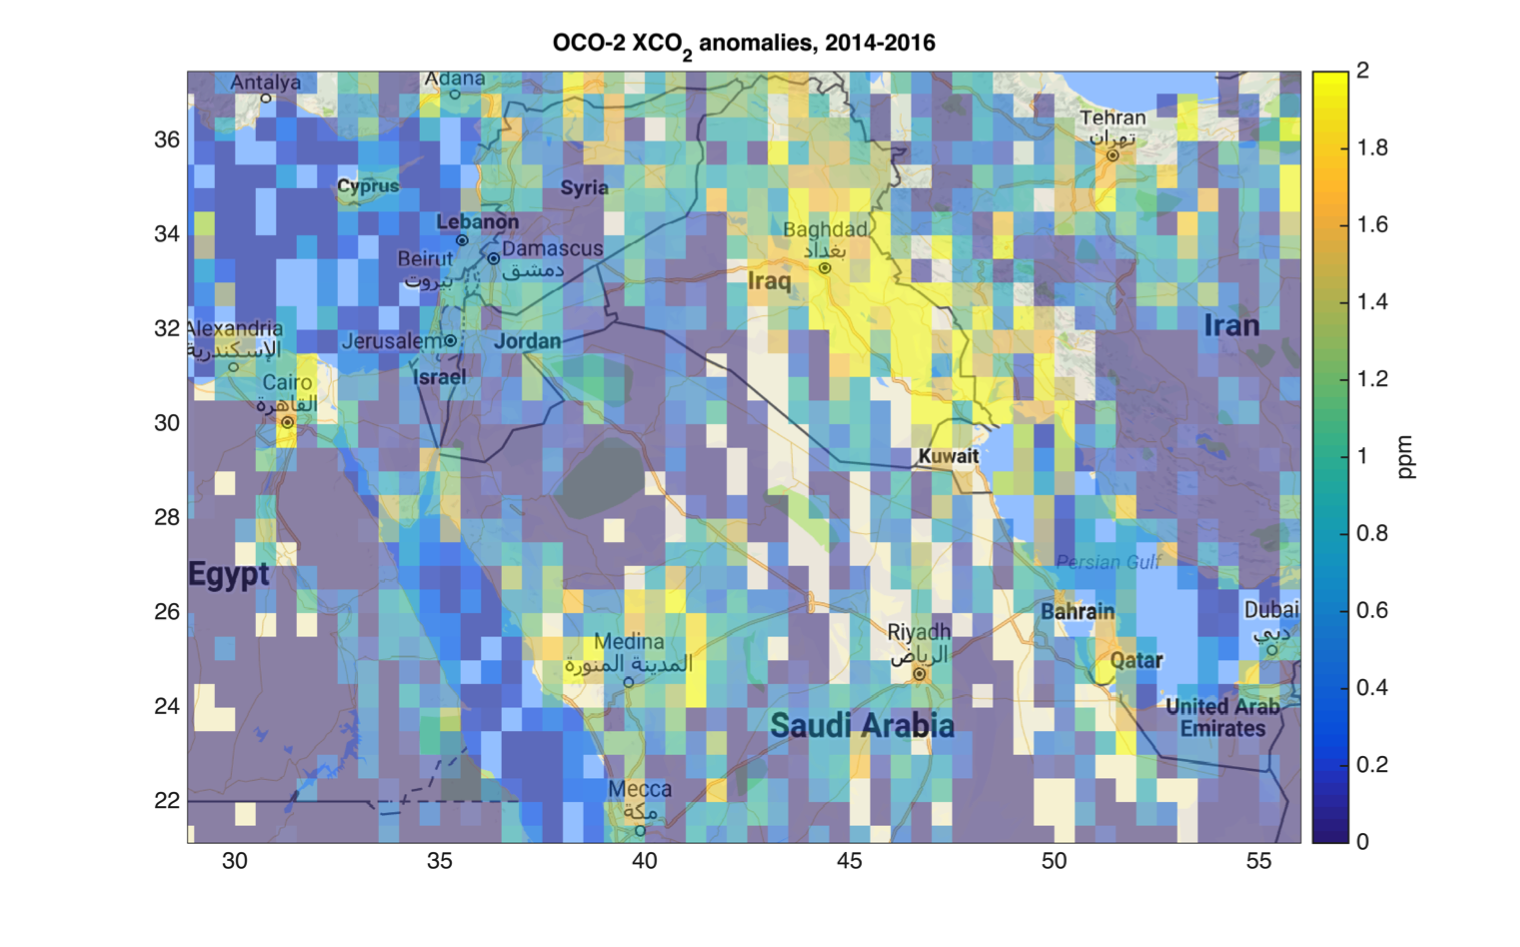
Our main finding was that satellite-based CO2 measurements alone can provide information about the areas where most of the atmospheric CO2 is produced. Satellite observations have revolutionised the way we monitor air pollution, for example providing very detailed maps of nitrogen dioxide (NO2), as I showed in my previous posts. Because of its long lifetime (many years), deriving information on the CO2 emission areas is not as simple, as CO2 gets transported far from its source. We developed a simple methodology to derive the CO2 anomalies and their spatial distribution. Look for example at the picture from the Middle-East region: we can spot oil extraction areas in Iraq and Saudi Arabia as well as isolated cities, such as Kairo, Riyadh, Mecca, Tehran and the state of Qatar.
In this study we analysed the atmospheric CO2 concentrations measured by the NASA’s OCO-2 (Orbiting Carbon Observatory-2) instrument (available since September 2014). The results open new possibilities for monitoring anthropogenic CO2 from space. Further studies and new instruments will provide new insight on greenhouse gas monitoring and climate research. In the future, we might be able to verify the changes in the anthropogenic CO2 emissions and the effect of climate change mitigation actions.
If you are interested in the topic, you can have a look at the scientific paper by Hakkarainen et al. (2016): http://onlinelibrary.wiley.com/doi/10.1002/2016GL070885/full